


Smartsheet Maps
Published on 12 March 2014
![]() Today’s the day! Smartsheet Labs is live and we’ve got two exciting, brand new apps for you to test out, both great resources help you take a more visual spin on the information your team is tracking in Smartsheet. Smartsheet Maps allows you to take any location-based data stored in Smartsheet and plot it on a map. You can also group your data and color code it based on specific criteria.
Today’s the day! Smartsheet Labs is live and we’ve got two exciting, brand new apps for you to test out, both great resources help you take a more visual spin on the information your team is tracking in Smartsheet. Smartsheet Maps allows you to take any location-based data stored in Smartsheet and plot it on a map. You can also group your data and color code it based on specific criteria.
Here are a few ways you could use Smartsheet Maps to help you be more productive:
-
Map your clients’ locations in relation to each other to strategically plan your team’s on-site calls.
-
Map your retail stores and plot them out, grouping them by revenue numbers.
Using Smartsheet Maps
To start, go to Smartsheet Labs and click "Login with Smartsheet."
The first time you login, you’ll need to give Smartsheet Labs access to your account. Follow the prompts and allow Smartsheet Labs access to your Smartsheet data (you can always change this later in your Smartsheet Personal Settings).
Click on the tab at the top for Smartsheet Maps.
Smartsheet Maps takes you directly into the Edit Map dialogue box. To return to this in the future, simply click on the pencil icon above the map. The rest is completed in two simple steps:
- Step 1: Choose a Sheet
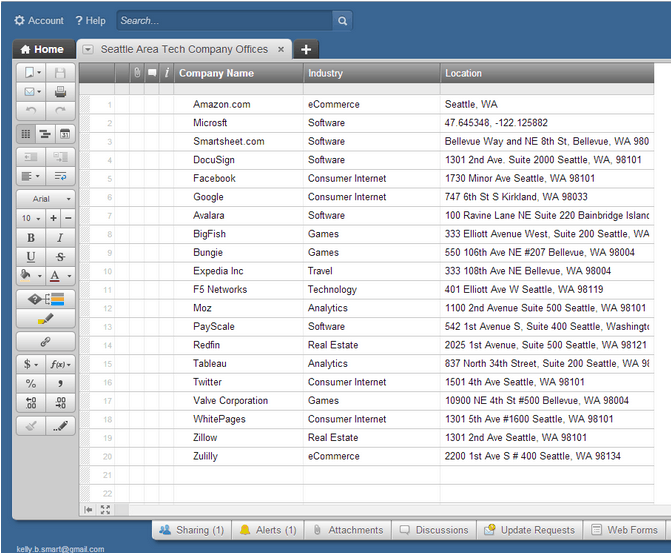
Select a sheet or report that has location data, such as addresses, cities, states, countries or longitude and latitude coordinates. (Here's a sample sheet you can use to follow along on this walkthrough).
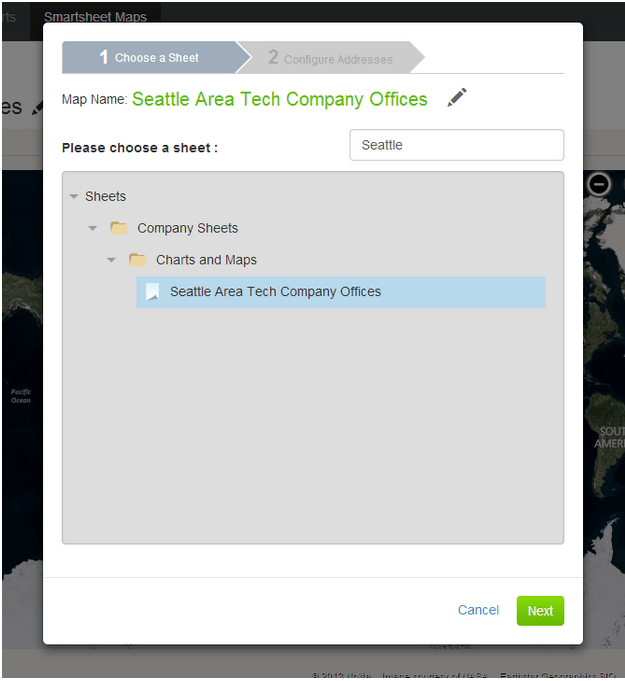
Once you have selected the sheet to map, click "Next"
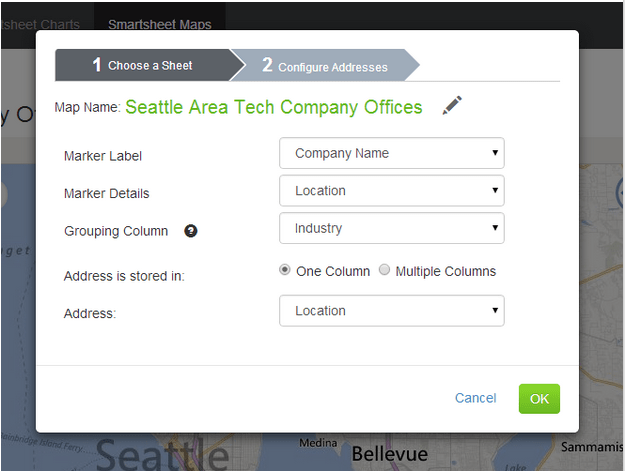
- Step 2: Configure Addresses
Once you’ve chosen your sheet, you have a few options to customize your map and the way data will show up.
Marker Label: This is the title on the information window when you hover over or click on a marker.
Marker Details:This the detail text for the information window when you click on a marker.
Grouping Column: This allows you to group your locations together by any value, and color code the groups. Each unique value in this column constitutes a group. Up to 12 unique colors will be used.
For instance, if you have a sheet of clients' addresses with an "Assigned To" column for the rep assigned to the column, you could group by the "Assigned To" column and each rep would have its own color marker. You would also be able to hide and show each group using the legend on the right of the map.
Address is stored in:Choose whether your location data is stored in a single column or multiple.
Address, Address Line 1, etc: Tell Maps where your location data is stored in your sheet.
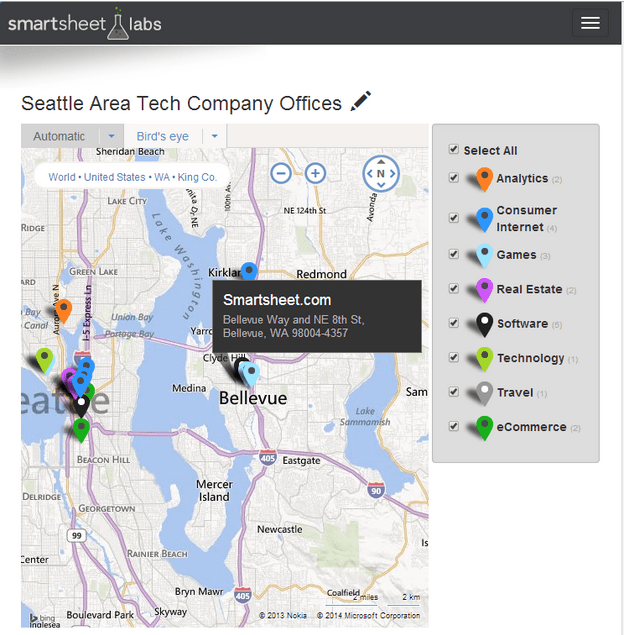
Once you’ve configured your map, click "OK" and watch it come to life with location markers flying onto the map.
We hope you find that Smartsheet Maps is useful, easy to use, and makes you more  productive in your quest to get things done. We also hope it helps you understand the power of building with the Smartsheet API.
We are just getting started with Smartsheet Labs - if you have any great ideas that you'd like to see built, we'd love to hear from you.
Developer Relations
Author
Smartsheet Developer Relations Team

